Sample Projects
Unleash your “inner scientist!” Learn how easy it is to capture an exciting star spectrum using just a standalone DSLR, or telescope with a video or FITS camera.
In the video below, Senior Sky & Telescope editor Dennis di Cicco talks with Tom Field of Field Tested Systems about the growing number of amateur astronomers doing backyard spectroscopy with simple equipment. “Most amateurs are astonished at how easy it is,” he says. Field also demonstrates his RSpec program, which transforms the image of a spectrum (including real-time video images) into a calibrated graph showing spectral features.
New to spectroscopy? Or already doing spectroscopy but want to do more? Watch the video below to see some of the easy projects that you can do with a small telescope:
A Personal Message from Tom:
I want to make a confession here. When I first started doing spectroscopy almost ten years ago, I didn’t know a lot of the science you’ll see further down this page. I’m being quite honest here. I was a visual observer and imager. But I didn’t know much about the science behind what I was observing.
When I began to capture spectra, I made an exciting discovery: when you capture data yourself, it has added meaning. You care about it. You want to know more. You go out and look things up on Wikipedia. You begin reading elementary books on the topic. And: you actually remember more of what you’re reading because it describes data that you’ve captured yourself.
For me, spectroscopy has opened up a much, much deeper dimension to all of my observing. It can do the same thing for you! Have questions? Get answers from me using our live chat or contact form: link.
Sample Spectroscopy Projects
The page below shows some examples of the kinds of projects that can be done with a low-resolution diffraction grating, like our Star Analyser or the Rainbow Optics Star Spectroscope. With one or two clicks in our RSpec software, you can convert a standard FITS, jpg, RAW, or video image to scientific data like that below. Spectroscopy has finally become accessible to amateurs!
You can post questions about these projects on the RSpec forum (link) or email us via our contact form (link).
Characterizing Star Types: You can use as small as a 4″ telescope or even just a DSLR to capture a collection of spectra of stars of different OBAFGKM temperatures. When you compare the spectra to one another, you can spot differences in the absorption lines as shown below. You can also determine the star’s approximate temperature and type by comparing their spectra to those in the RSpec Reference Library. RSpec comes with a complete set of videos that walk you through this process, step by step.
Below is a sample of some of the excellent work done by Torsten Hansen, using a Star Analyser grating, an 8″ Newtonian, and just an astronomical video camera. If you have a FITS camera or DSLR, you can easily capture this kind of data and much more!
Each row in the table below is a different star.
From top to bottom, the spectra are in temperature order. Notice for example, that the cooler stars near the bottom have some broad absorption bands in the red end of the spectrum. That’s the absorption from complex molecules that survive because the surface temperature of these stars is so “low.”
Also notice below, for example, that the Hydrogen Balmer (beta) absorption line at 4861 Angstroms is the strongest for the Type A star. This particular Hydrogen transition isn’t as prevalent in the hotter or cooler stars. See? There’s a lot we can learn from such easy-to-capture data. And, if it’s data you captured yourself, you’ll be amazed at how much easier it is to learn and remember!
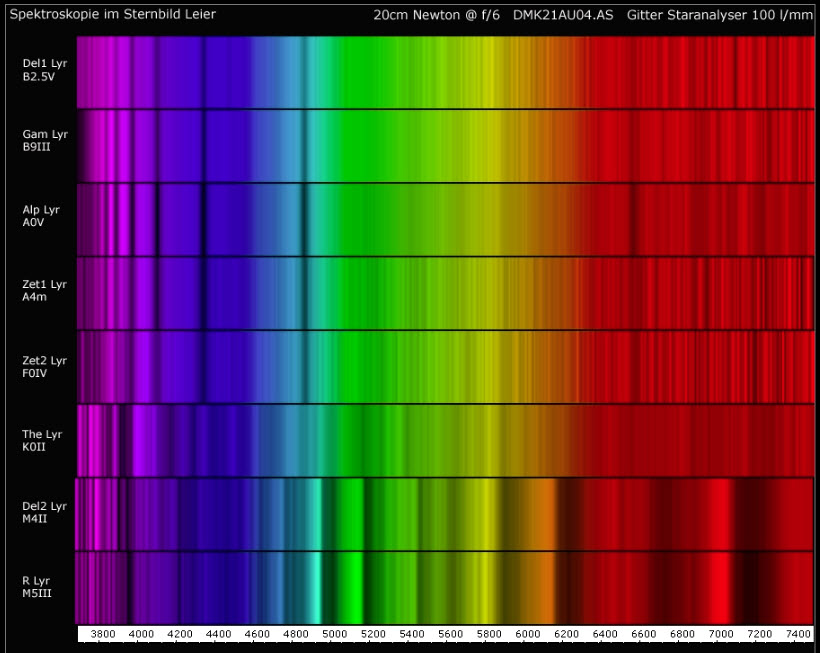
Different star types have different spectra. Each row is a different star type from the OBAFGKM classification.
Detect the Emission lines on an Emission Nebula: An emission nebula is surrounded by a gas shell that is excited (like a fluorescent light). Below is a spectrum of the Saturn Nebula clearly showing its emission lines. The Orion Nebula (M42) would have similar features, but because it’s an extended object, would require a slit spectrometer.
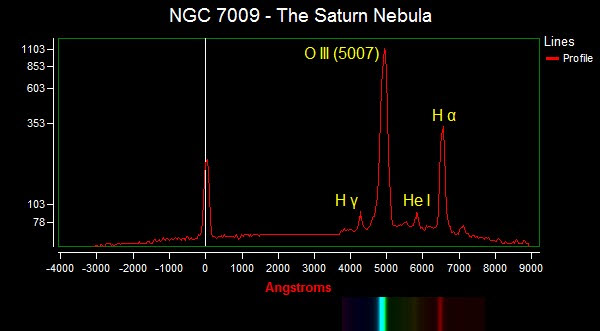
Emission lines of a distant nebula!
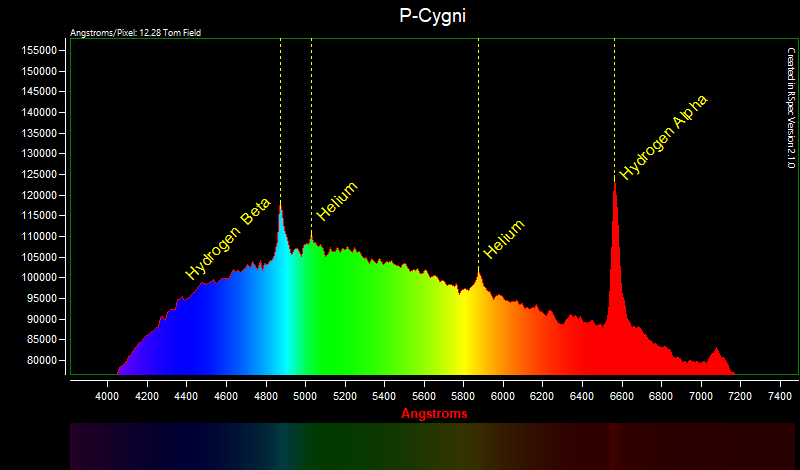
Detect the Spectrum of a Super-giant: The super-giant P-Cygni shows distinct emission lines in the image below. Notice how they differ from the Saturn Nebula above. You can read the fascinating story of this star at this Wikipedia link. (Credit: Barbara Harris: ~1-second exposure using a 5″ refractor)
Study Star temperature and structure: The Albireo double (see inset) is, of course, the beautiful blue-gold showpiece that many of us are familiar with. The image below shows the spectra of its two main stars. You can easily see the energy on hotter Albireo B is concentrated in the blue end of the spectrum. And the energy of the amber star is towards the cooler red end, peaking in the amber/yellow region as expected. Notice the emission line (circled) at 6562? That’s from a glowing disk of gas surrounding Albireo, which is a “Be” star. Wow! (Credit: Ken Whight)
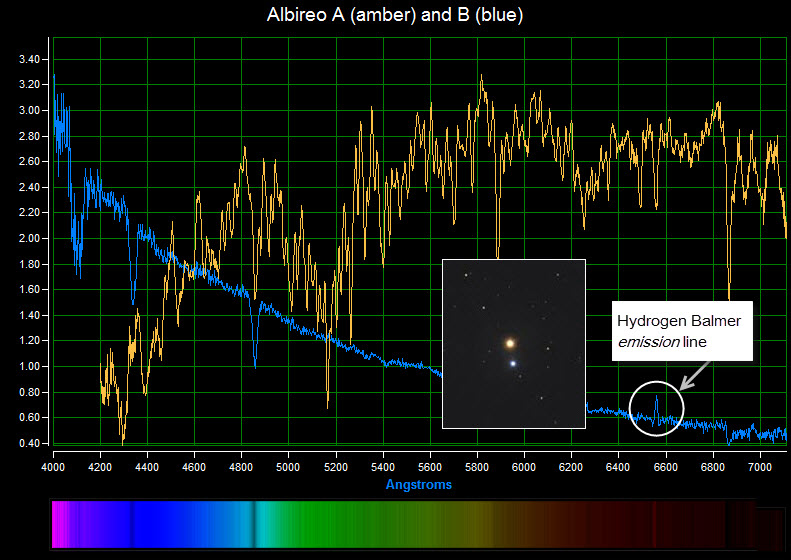
The cool and hot Albireo double stars
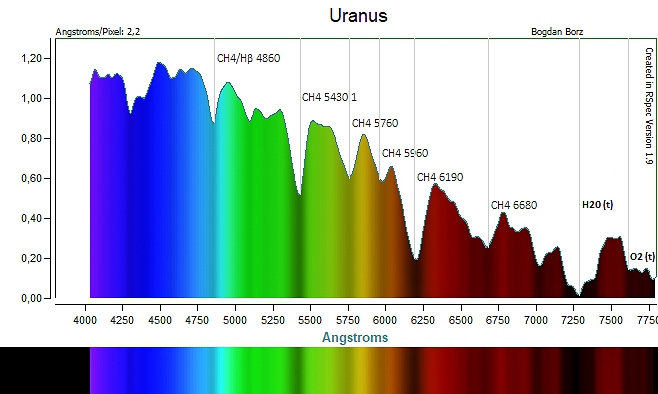
Detect the Methane atmosphere in Neptune or Uranus: The image below by Bogdan Borz in France. It clearly shows the Methane in Uranus’s atmosphere. Bogdan captured Uranus’ spectrum with our Star Analyser grating on a 4 1/2″ refractor with a ZWO video camera. The original image and details are on Bogdan’s site: here. Also, see link for an interesting write-up on the enormous methane storms on Uranus.
Detect the Red Shift of a Quasar that is 2 billion light-years away. William Wiethoff’s spectra (below) of QSO 3C 273 shows the redshift due to cosmological expansion. Many amateurs capture this spectrum on 8″ telescopes with less than 15 minutes of integration time. (This is a mag 13 object in Virgo. For a list of similar quasars visible at different times of the year: link.)
Recommendation from Tom:
“There’s a wonderful interview with Maarten Schmidt, the discoverer of this first quasar. It’s exciting and fun to read such a personal account by a world-known professional. Download the pdf: link.
He describes in simple terms how he made his discovery and his persistence, his fear and self-doubts, jubilation, working with colleagues, and the celebration on the night of the discovery.”
Also, here’s another site with information about quasar spectra with a Star Analyser: link.
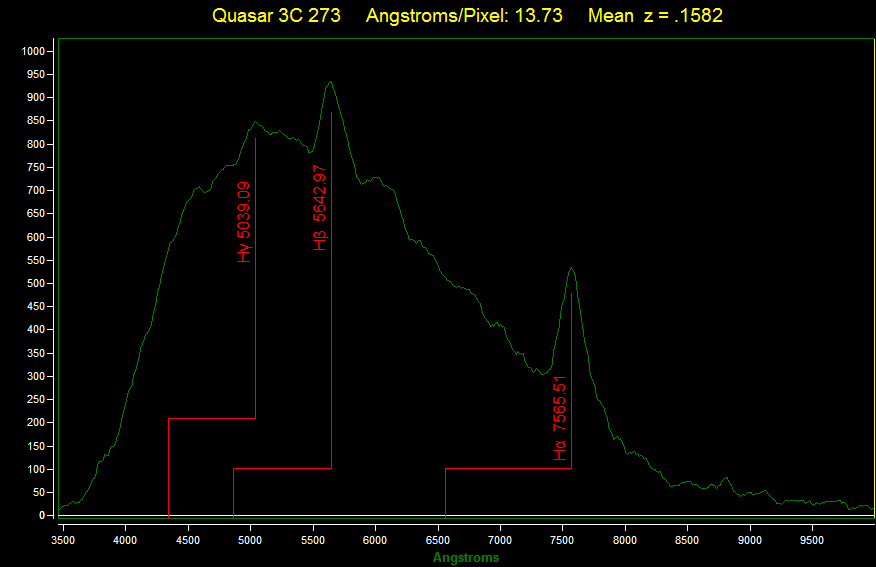
The cosmological redshift of a quasar. 15 minute stacked with just an 8″ SCT
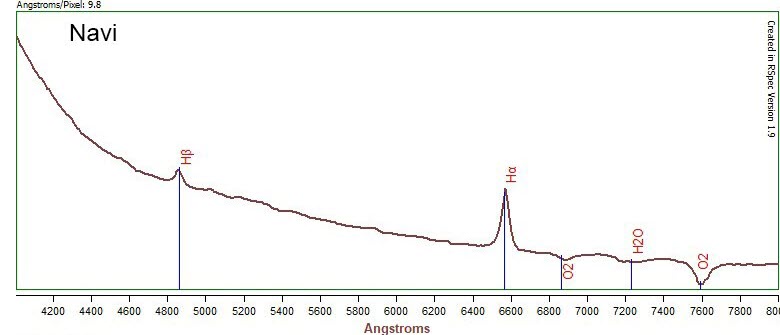
Below is the spectrum of the easily findable Navi in Cassiopeia. It’s an eruptive variable Be star with an interesting spectrum with emission lines from a circumstellar disk. See Wikipedia for more info: link. Credit: Johannes Clausen used 96 frames from a ZWO ASI120MM video camera on a C8.
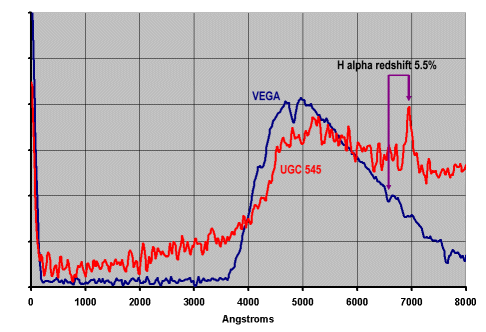
Measure the redshift of galaxies with a Star Analyser!
Want to measure the redshift of a galaxy? The image below shows the spectrum of Seyfert Galaxy UGC 545, a mag 14.1 galaxy with an Active Galactic Nucleus.
Not all galaxies are suitable for this measurement with a Star Analyser grating. The high luminosity of this galaxy’s core makes it visible despite being at a significant distance from us. And the compact, almost stellar appearance allows our Star Analyser diffraction grating to be used.
Credit: Robin Leadbeater, 8″ telescope and just a webcam! Link.
Red-shift of a galaxy with a Star Analyser and 8″ telescope
Wolf-Rayet Stars: The spectrum below is a fascinating view of a Wolf-Rayet star by Janet Simpson using just a Canon 350D DSLR, 85 mm lens, 30-second exposure with AstroTrac mount. She used the Star Analyser 100 for a grating. (For mounting hints, see this link.)
Wolf–Rayet stars are a normal stage in the evolution of very massive stars, which continually eject gas into space, producing an expanding envelope of nebulous gas. Notice the wide Carbon emission bands! Their width is attributed to the Doppler effect because the gas surrounding these stars is moving with velocities of 300–2400 km/s along the line of sight.
Here’s what Wikipedia has to say about Wolf-Rayet stars:
“The characteristic emission lines are formed in the extended and dense high-velocity wind region enveloping the very hot stellar photosphere. This produces a flood of UV radiation that causes fluorescence in the line-forming wind region. This ejection process uncovers in succession, first the nitrogen-rich products of CNO cycle burning of hydrogen (WN stars), and later the carbon-rich layer due to He burning (WC & WO stars). Most of these stars are believed finally to progress to become supernovae of Type Ib or Type Ic.” (Credit: Wikipedia link)
Yes, it doesn’t take a ton of gear, skill, and dark skies to capture fascinating spectra like this one! It’s images like this that we find so enormously exciting.
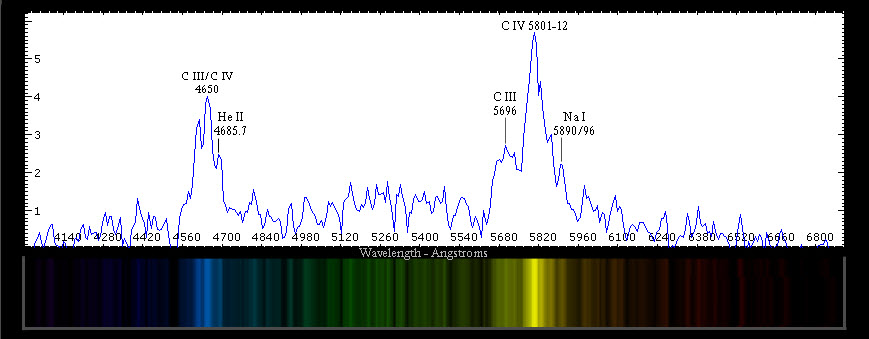
The carbon emission near the core of a Wolf Rayet star
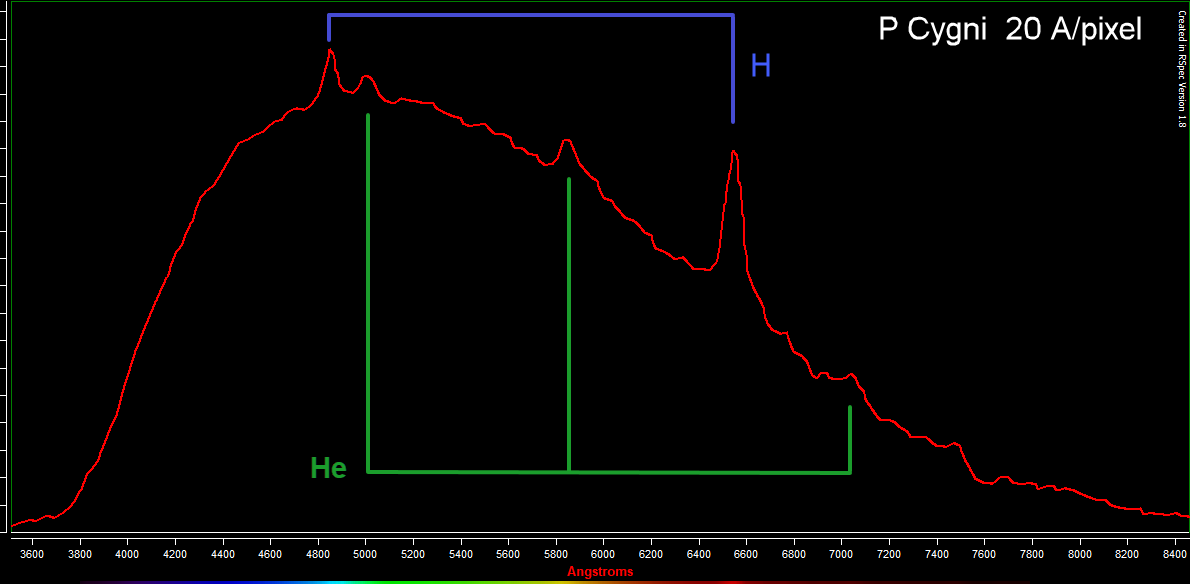
P Cygni Emission Lines
P Cygni is a Blue Supergiant and is one of the most luminous stars in the Galaxy. It is famous for the characteristic spectrum line profile which bears its name — an emission line paired closely with a blue-shifted absorption line. Emission lines due to Hydrogen and Helium can be identified. The characteristic P-Cyg blue-shifted absorption bands are not resolved however at this low dispersion. (A dispersion at least 5x greater would be needed.) Credit: Robin Leadbeater using a webcam, his VC 200L, and a Star Analyser (link).
Solar Spectroscopy: Capture the spectrum of the sun. You can have fun doing astronomical spectroscopy and still get a good night’s sleep!
Use a ball bearing or a sewing needle with a dark backdrop to get a spectrum of the sun. The photo below shows a sewing machine needle on a piece of folded black construction paper. It’s oriented so that the fold casts a shadow, providing a dark background for the spectrum that appears in your camera. Never look directly at the sun or its reflection. They can cause permanent blindness.
David Haworth has published a creative and inexpensive apparatus that you can easily build to capture spectra of the sun. (For details, see his site: link.)
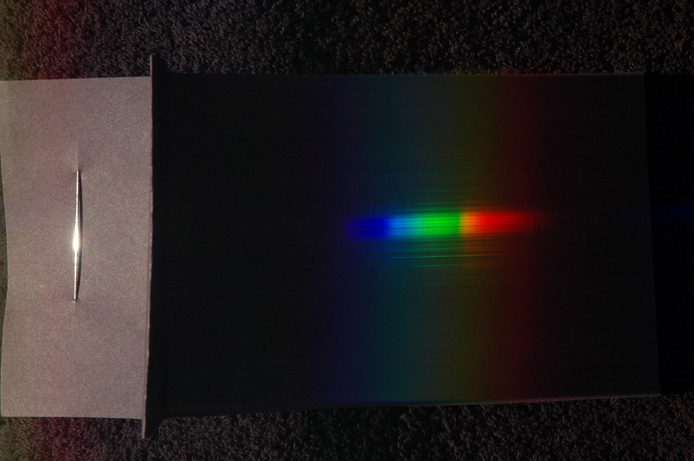
Using a sewing needle to capture a solar spectrum
Below: The above spectrum, when processed in RSpec, clearly shows the sun’s Fraunhofer lines in the 2019 total eclipse..
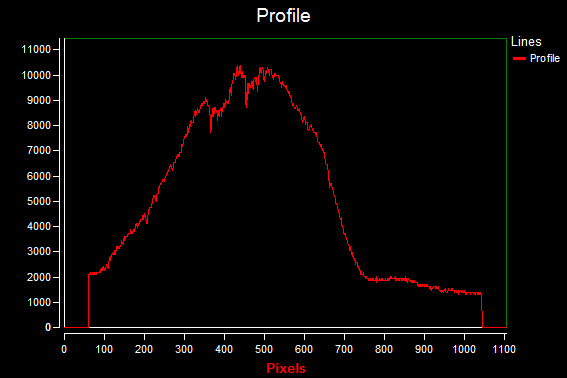
The Sun’s Fraunhofer lines
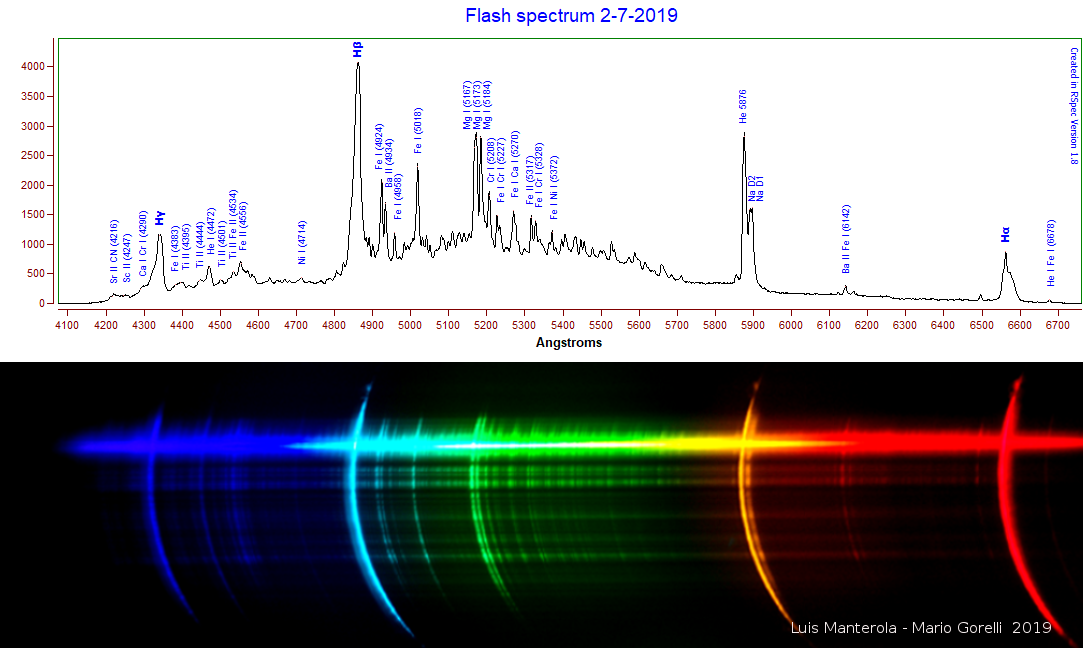
Eclipse Flash Spectra: Luis Materola from Argentina captured this wonderful spectrum using a homemade high-resolution (600 line/mm, 1.3 Angstroms/pixel) spectrometer. He processed the images with RSpec. The Sodium doublet and Magnesium triplet are clearly visible.
Changes in a variable LL Lyr star: This wonderful animation is just one evening‘s worth of images. This was created by Umberto Sollecchia in Italy with just a 110mm refractor and a Star Analyser grating. Watch how the temperature of the star changes and how the Hydrogen beta line (at 4861) and others come and go! This amazing and exciting animation by Mr. Sollecchia shows the exciting kinds of observations that can be made by amateurs with small telescopes. (RSpec does not have this animation capability. However, RSpec’s can show the changes that occur over time using the Presentation Manager. See this link for an example.)
Click the image below to see a beautiful animation.
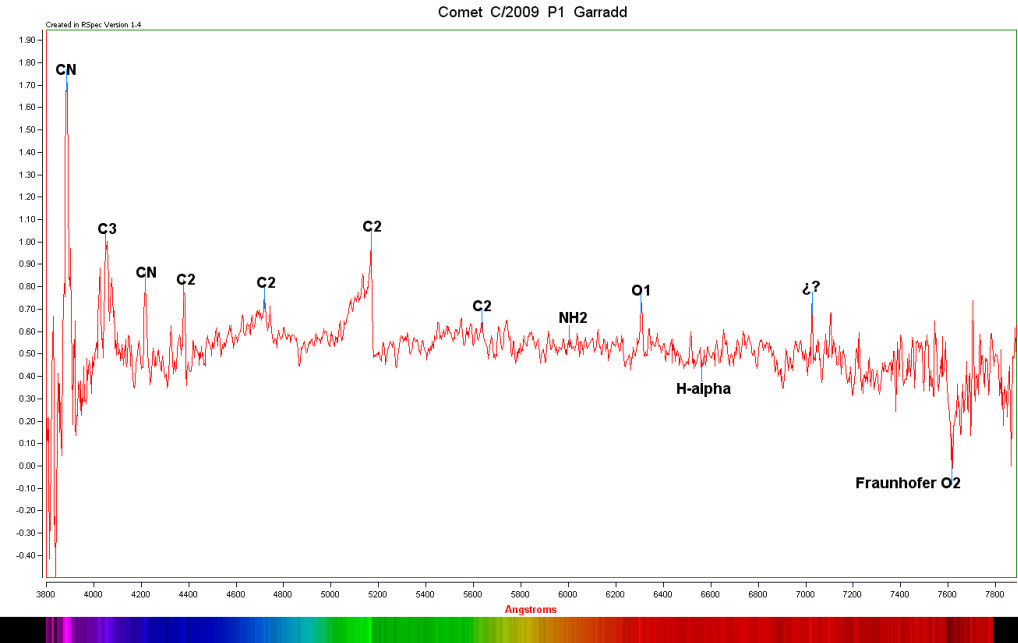
Below is a great spectrum of a comet captured with a slit spectrograph. Notice the variety of complex molecules. These complex molecules are thought to have provided the raw material that formed the building blocks of life when they pelted the Earth during its early history. (Credit: Rainer Ehlert)
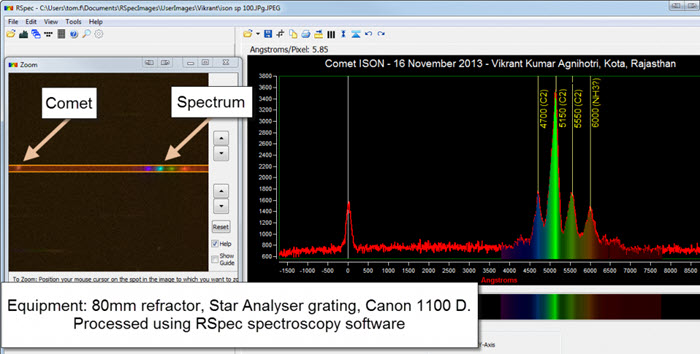
Comet spectra: The spectrum below of the comet ISON shows how easy it is for amateurs to study astronomical spectra. Vikrant Kumar Agnihotri in India captured this wonderful spectrum of ISON using a just an 80 mm refractor, simple Star Analyser grating, and a DSLR. It clearly shows the green glow from glowing Carbon (the so-called “Swan bands” – Wikipedia link) This image was captured from a rooftop in Rajasthan, and then processed in the RSpec software:
Supernova: Below is a wonderful spectrum of a supernova imaged by David Strange in the UK. The deep absorption marked as Silicon II is an indicator that this is a Type Ia supernova. At the time he took this image and created the profile, David had been using RSpec for just over a week.
What continually amazes people is how little integration time is needed to capture spectra. This spectrum was captured on a 9″ SCT, with only 30 twenty-five-second images! We’re not talking about hours of integration time here, nor large aperture. Dark sky sites aren’t required either – spectroscopy is considerably less affected by urban light pollution than visual imaging.
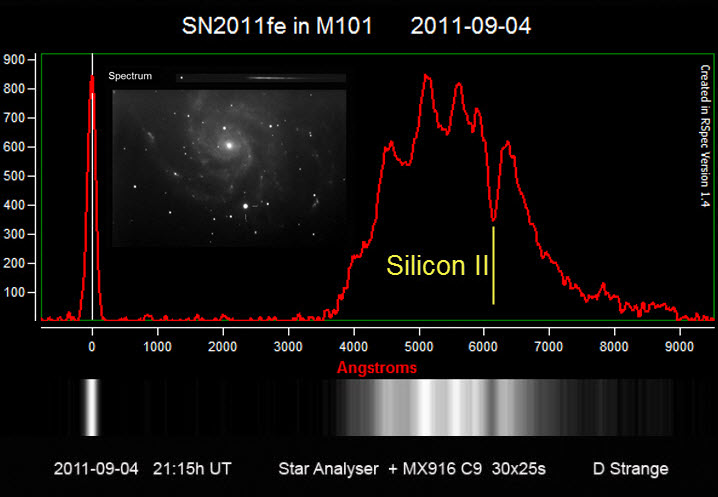
Supernova spectrum shows the fingerprint of a Type Ia
To download the original FITS image that was used to create the above profile (courtesy of David Strange), right-click this link.
Here’s the often-cited 1997 paper by Filippenko that is often cited: link. Although it is fairly technical, it discusses some of the features that you can detect with a Star Analyser.
Here’s a video that discusses how the above spectrum was calibrated: link.
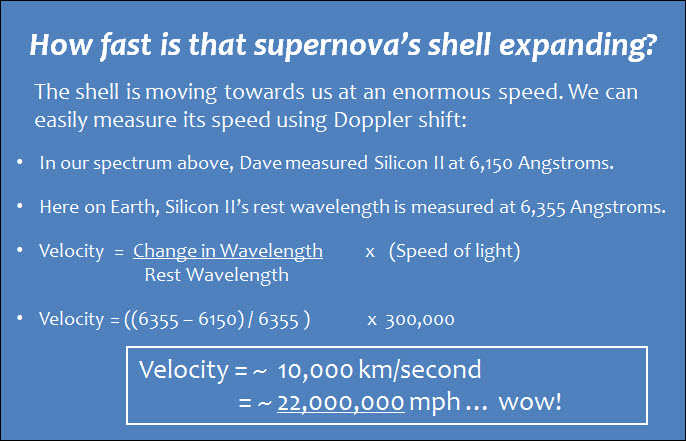
A final comment on the above spectrum and calculation: this is jaw-droppingly exciting stuff. Imagine a backyard telescope measuring the Doppler shift of a supernova!
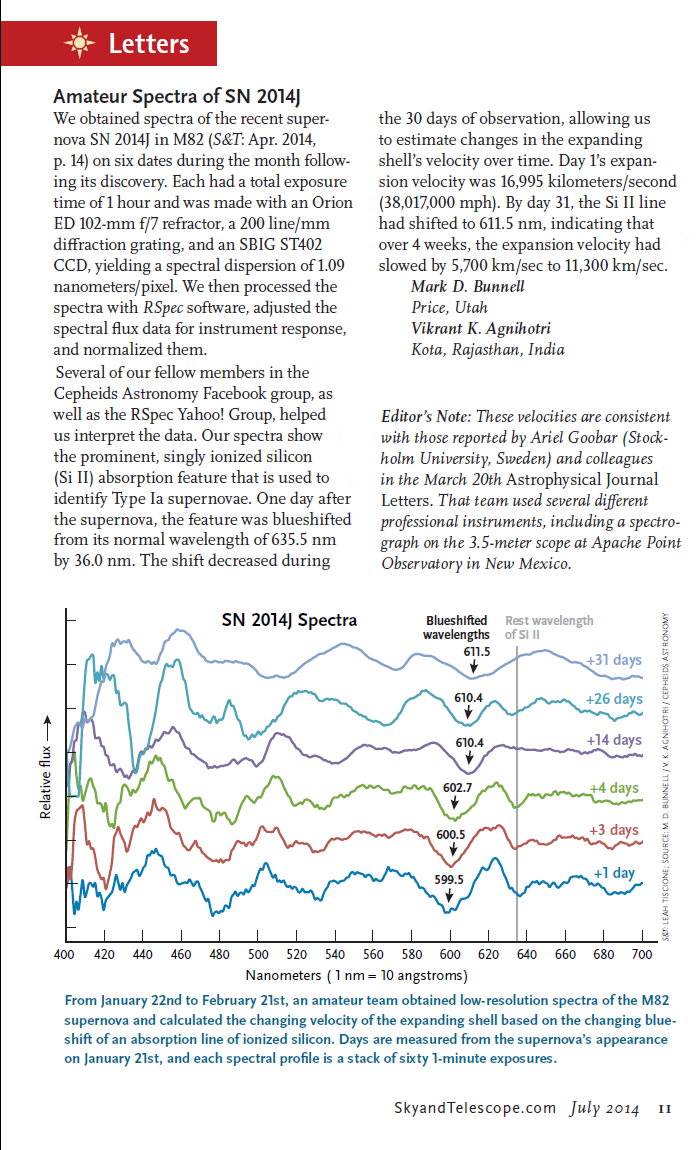
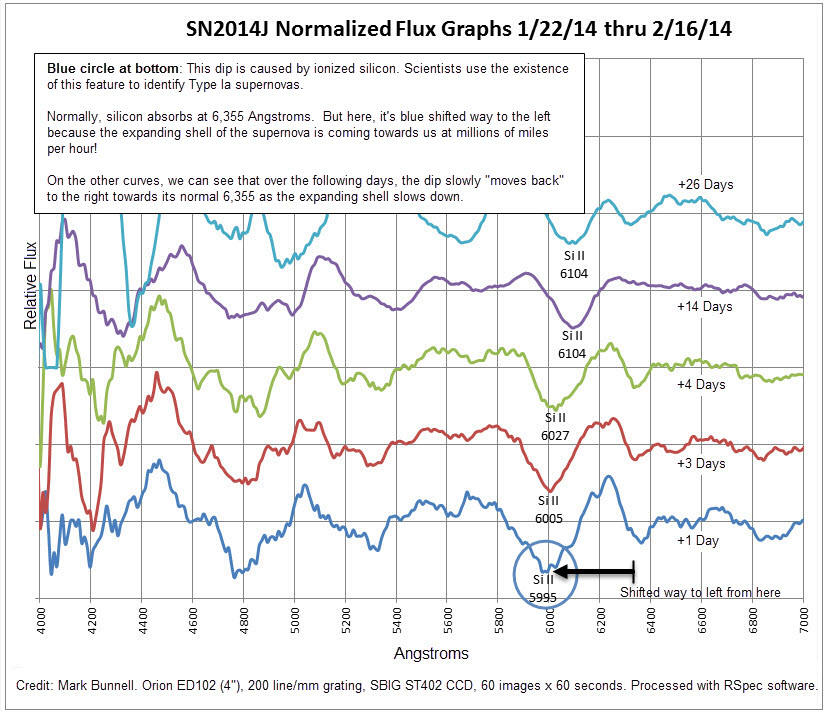
Observe the changes in a supernova over a few weeks: Below is a series of spectra taken of a recent supernova during the days and weeks after the event. These were taken with just a 4″ refractor!
Here’s the full description (pdf) as it appeared in Sky & Telescope Magazine: link.
Nova Spectrum: Below is the spectrum of Nova Del 2013. Alfred Tan captured this image in Singapore, using his just 90 mm Williams Optics APO and an Imaging Source astronomical video camera. The Hydrogen emission lines are very clear and typical for this type of nova.
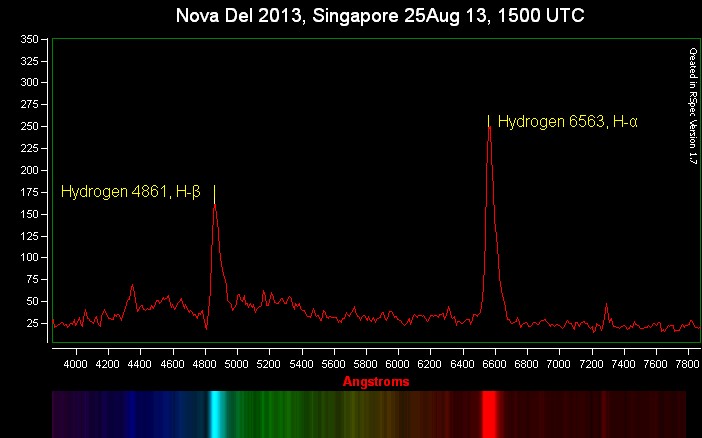
The emission lines of a nova star
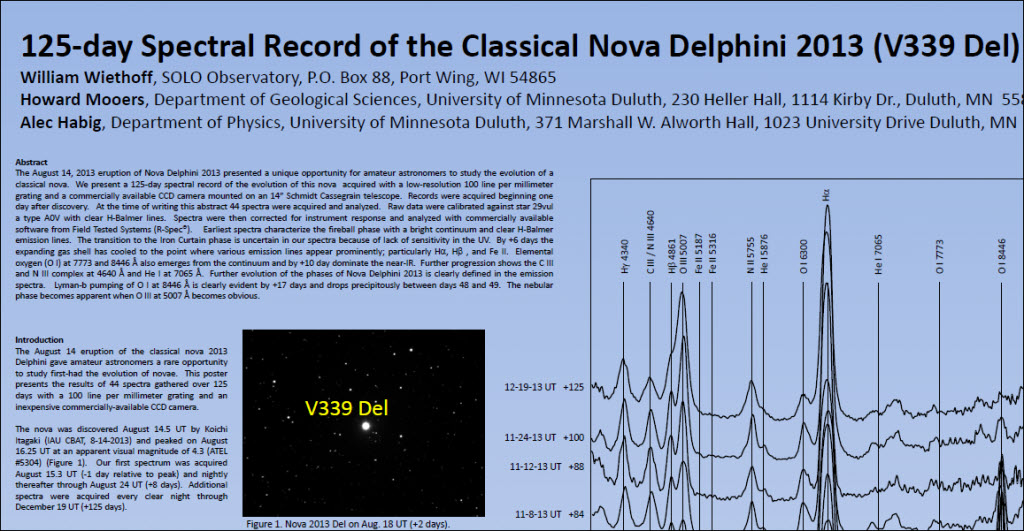
Study Nova Evolution: Below is a poster that was presented at the 2014 American Astronomical Society meeting. Using a Star Analyser grating and RSpec, a team at the University of Minnesota captured 44 spectra of Nova Delphini 2013 over a period of four months. Major phases of the nova evolution can readily be identified. Click on this link to download the complete poster.
Carbon Stars: Below is a wonderful image showing the C2 Swan bands on several Carbon stars. Notice how much stronger the signal is in the right-hand, red end of the spectrum. Read more about Carbon stars at this Wikipedia link. Credit: Torsten Hansen with just a 20 cm (8″) telescope, a Star Analyser grating, and an astronomical video camera.
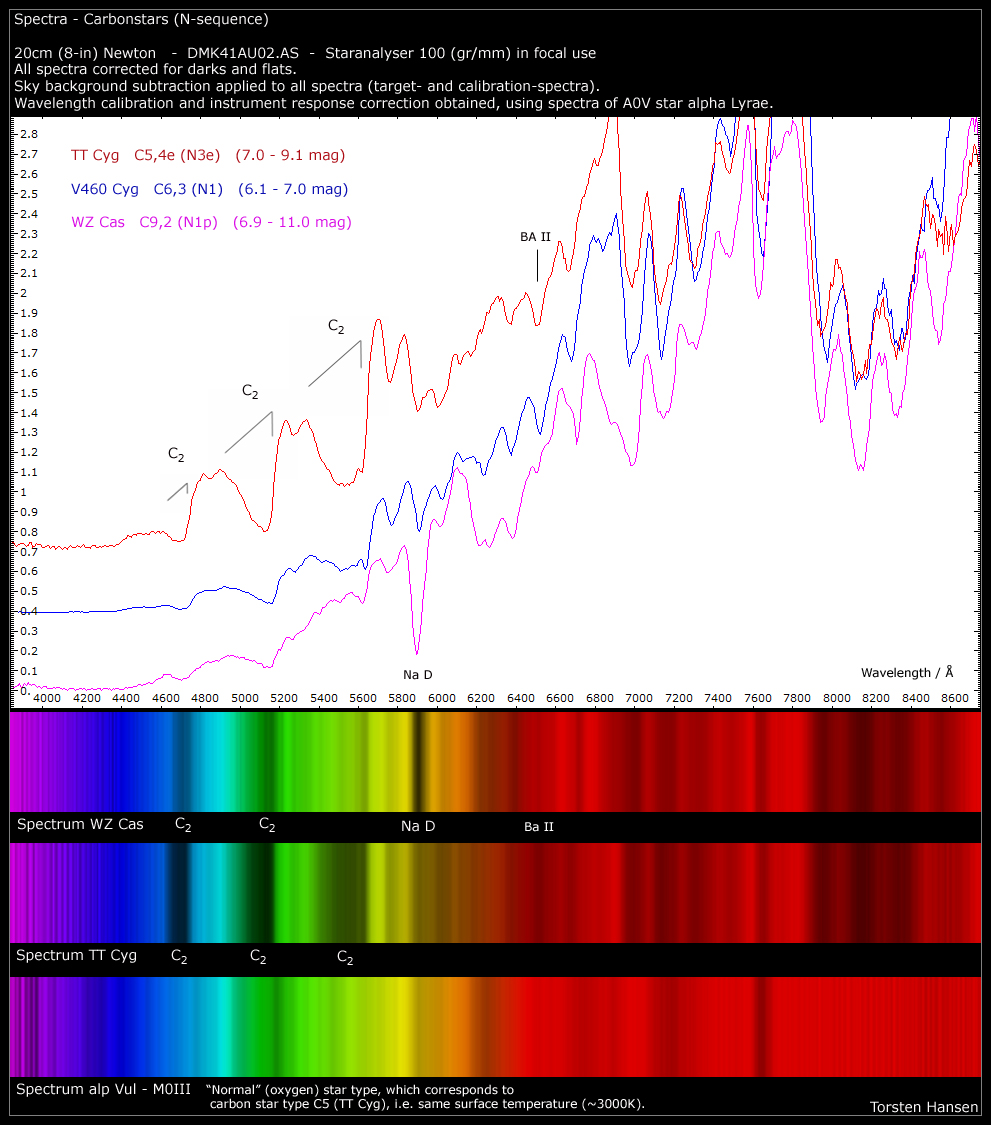
Carbon star spectra
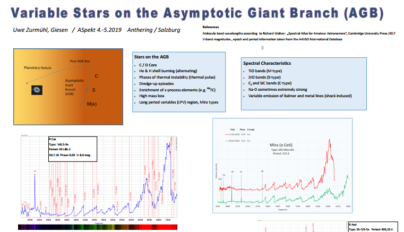
Star Evolution: RSpec user Uwe Zurmühl presented his findings on variable stars in the AGB branch at a recent conference on variable stars. This is exciting science being done by an amateur astronomer and a Star Analyser in a GRISM configuration. Here’s how he describes his work:
Near the end of stellar evolution, stars with about 1-8 solar masses undergo massive changes in the star’s atmosphere while climbing up the asymptotic giant branch (AGB). This is reflected in characteristic spectral features. In the beginning, the spectra resemble those of M-type giant stars, showing strong molecular TiO absorption bands. When evolving to S-Type giants, the star’s atmosphere is enriched which carbon and zirconium, while the amount of oxygen decreases. As a consequence, the TiO bands are replaced by ZrO bands. In the last stage, we see “carbon stars” with absorption bands of C2 and SiC2.
The well-known pulsating variables of Mira type can be found in the AGB region. They often show emission lines of hydrogen and metals, varying with the pulsation phase. The present project is trying to monitor the spectral changes over several pulsation periods, using slitless transmission grating setups with medium resolution (R about 1000 – 2000). Link. Also see pages 10 – 18 in this pdf: link.
Here’s a great spectroscopy observing plan by an RSpec user: link. You’ll see a wide, wide range of exciting spectra. As you capture spectra of these objects, read up on each of them (even if it’s just Wikipedia entries). You’ll be building a foundation of knowledge that will astonish you.
Spectra Library of Constellations: This library represents an ongoing personal campaign by an RSpec user to collect and analyze spectra for various stars using the SA100 and RSpec. The choice of stars corresponds to those stars comprising the constellation lines for each region (according to Stellarium). The main goal has been to gather experience collecting and analyzing as much data as time and the weather permits. The processes and equipment used are outlined in detail in the .zip file and should be easy to follow. Download the library zip file here: link.
Any questions or comments about the library can be directed to [email protected].
It’s likely that you already have the telescope, camera, and skill that would allow you to capture these kinds of exciting spectra! Have you always wanted to do a bit of science? Astronomical spectroscopy is surprisingly easy and a good way to unleash your “inner scientist.”
Gas Tube Spectroscopy: You don’t need to buy a telescope or expensive grating to do spectroscopy! Check out our video spectroscope: link.
Flame Emission Spectroscopy: No, it’s not astronomy either, but you can do it in the comfortable indoors during the winter! Check out our video spectroscope: link. The final portion of the video there shows how you can easily do flame spectroscopy!
Do you have a spectrum we could post here? Low-resolution spectroscopy can also be used to identify variable star types, novae and the occasional bright super-novae (as shown above with SN2011fe). If you have samples of this kind of work or other low-resolution spectra of any type that you’d like to see posted here, contact us.
All images on this site are used with the permission of their respective authors.